0

/c/map_enthusiasts has rapidly grown! Looking to add more mods, apply in this thread.

preview

Hi folks! There hasn’t been any misbehavior in this community, nor to be frank do I expect any, but it’s good to have redundancy, cover more time zones, etc… in case of spambots and the like. I’m looking to add a couple more mods!

I don’t have many metrics by which to choose fellow mods (such as the age of the account) so all you need to apply and get picked is to be active in this community (which means contribute posts and/or comments… the more quality contributions you’ve made the more likely you’re to get picked). I’m CET, btw.

If you want to guard this community and help it stay a cozy place, apply here in the comments to become a mod. Feel free to add any additional reason why you think you should be picked! Are you a geographer? Are you power hungry? Are you glued to your computer an internet enthusiast? Apply now!

Applications will be open for a while until I pick a couple of peeps.

Hi folks! There hasn’t been any misbehavior in this community, nor to be frank do I expect any, but it’s good to have redundancy, cover more time zones, etc… in case of spambots and the like. I’m looking to add a couple more mods!

I don’t have many metrics by which to choose fellow mods (such as the age of the account) so all you need to apply and get picked is to be active in this community (which means contribute posts and/or comments… the more quality contributions you’ve made the more likely you’re to get picked). I’m CET, btw.

If you want to guard this community and help it stay a cozy place, apply here in the comments to become a mod. Feel free to add any additional reason why you think you should be picked! Are you a geographer? Are you power hungry? Are you glued to your computer an internet enthusiast? Apply now!

Applications will be open for a while until I pick a couple of peeps.

0

The Map Was Never Innocent: Africa, the Mercator Lie, and the Day the World Finally Said Enough

preview

Here in Ghana we carry an odd privilege in this story. The Greenwich Meridian passes through Tema. And the point where the equator meets the prime meridian sits in the Gulf of Guinea, just off our own coast. Geographers sometimes joke that Ghana is closer to the centre of the world than any other country. Yet generations of Ghanaian schoolchildren grew up looking at a map where the centre of the world was somewhere in Europe, and their own country looked like a footnote in the lower middle.

map-projections.net/compare.php?p1=mercator-84&p2…

en.wikipedia.org/wiki/Equal_Earth_projection

Here in Ghana we carry an odd privilege in this story. The Greenwich Meridian passes through Tema. And the point where the equator meets the prime meridian sits in the Gulf of Guinea, just off our own coast. Geographers sometimes joke that Ghana is closer to the centre of the world than any other country. Yet generations of Ghanaian schoolchildren grew up looking at a map where the centre of the world was somewhere in Europe, and their own country looked like a footnote in the lower middle.

map-projections.net/compare.php?p1=mercator-84&p2…

en.wikipedia.org/wiki/Equal_Earth_projection

0

As the UN adopts an equal world map, meet the three geographers who disputed how the Earth was charted 2000 years ago

The Conversation As the UN adopts an equal world map, meet the three geographers who disputed how the Earth was charted 2000 years ago theconversation.com
preview

As the UN adopts an equal world map, meet the three geographers who disputed how the Earth was charted 2000 years ago
https://theconversation.com/as-the-un-adopts-an-equal-world-map-meet-the-three-geographers-who-disputed-how-the-earth-was-charted-2000-years-ago-293297
@TheConversationUK @map_enthusiasts #maps #cartography #geography

As the UN adopts an equal world map, meet the three geographers who disputed how the Earth was charted 2000 years ago
https://theconversation.com/as-the-un-adopts-an-equal-world-map-meet-the-three-geographers-who-disputed-how-the-earth-was-charted-2000-years-ago-293297
@TheConversationUK @map_enthusiasts #maps #cartography #geography

0

Birthrights

Birthrights Birthrights birthrights-map.base44.app
preview

This is based on Richard Farson’s Birthrights. Most maps are named after chapters from his book. It’s come a long way since the last time I presented it a couple months ago and still has a ways to go, but I’m happy with how it’s turning out.

I’m especially interested in feedback on the Right to the Night map. I’m intending for that one to be a guide that motivated youth can use to fight curfew legislation.

One thing that surprised me in the research I did for the project is that VT has no minimum age to run for governor. There’s a 15yo on the ballot today and he’s not even the first minor to run, so if you’re in VT get out there and vote for Dean Roy.

Also happening today is the vote for allowing 16-17yos to vote in Culver City, CA. If you go to the cities part of the Political Power map, you can see the 16 cities nationwide that already have voting for 16-17yos.

I would imagine this project still works best on desktop, but if you have any feedback about the experience on mobile, that would also be welcome.

This is based on Richard Farson’s Birthrights. Most maps are named after chapters from his book. It’s come a long way since the last time I presented it a couple months ago and still has a ways to go, but I’m happy with how it’s turning out.

I’m especially interested in feedback on the Right to the Night map. I’m intending for that one to be a guide that motivated youth can use to fight curfew legislation.

One thing that surprised me in the research I did for the project is that VT has no minimum age to run for governor. There’s a 15yo on the ballot today and he’s not even the first minor to run, so if you’re in VT get out there and vote for Dean Roy.

Also happening today is the vote for allowing 16-17yos to vote in Culver City, CA. If you go to the cities part of the Political Power map, you can see the 16 cities nationwide that already have voting for 16-17yos.

I would imagine this project still works best on desktop, but if you have any feedback about the experience on mobile, that would also be welcome.

0

Equal-Earth Projection

preview

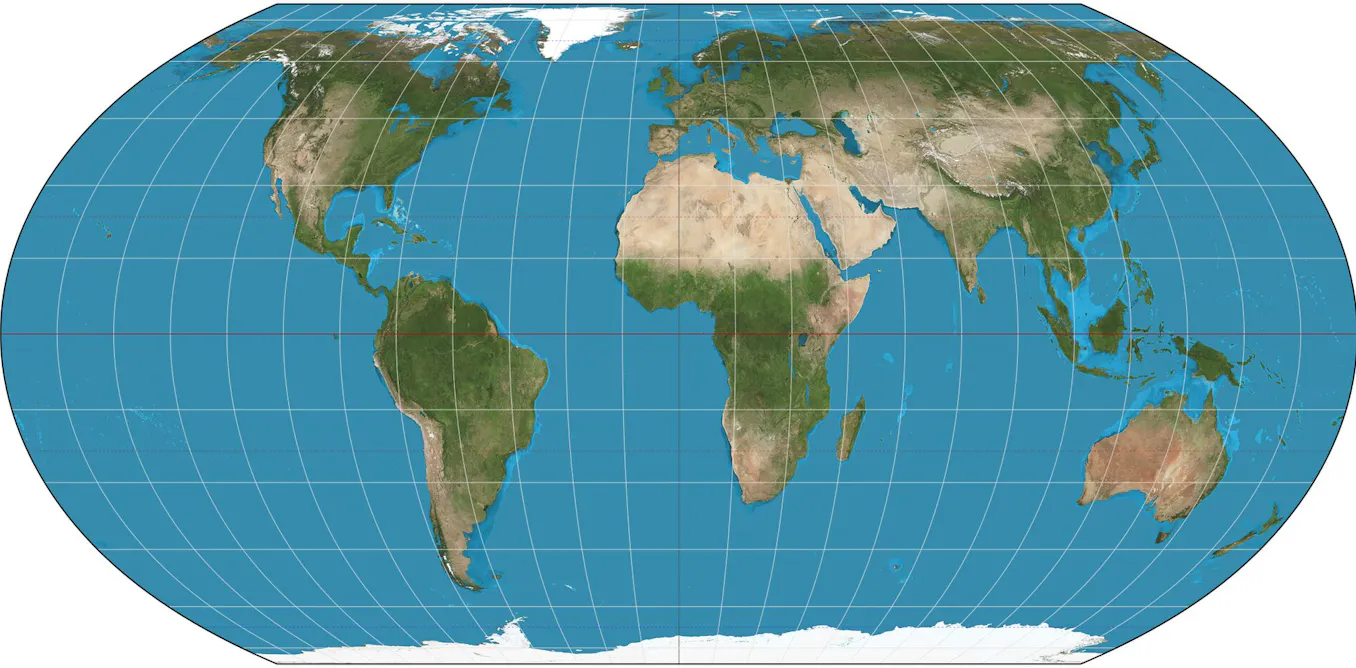
I recently learned about the Equal-Earth map projection. It seems to be the best balance for accurate shape and size of the globe in 2D. It was recently adopted by the UN to replace the Mercator projection.

I recently learned about the Equal-Earth map projection. It seems to be the best balance for accurate shape and size of the globe in 2D. It was recently adopted by the UN to replace the Mercator projection.

0

Every Real Place Mentioned in Sikh Scripture

preview

Sikhism is the 5th largest religion in the world. The scriptures of Sikhism are the Sri Guru Granth Sahib, Sri Dasam Granth, and Sri Sarbloh Granth. Interactive map at agamsingh.me/gurbani-places-map/

Sikhism is the 5th largest religion in the world. The scriptures of Sikhism are the Sri Guru Granth Sahib, Sri Dasam Granth, and Sri Sarbloh Granth. Interactive map at agamsingh.me/gurbani-places-map/

0

RE: https://en.osm.town/@seav/117372213490233596

preview

RE: https://en.osm.town/@seav/117372213490233596

Even if you don’t create maps follow along with #30DayMapChallenge for some inspiration and fun! Telling stories with maps. #histodons #mapping @map_enthusiasts @histodons @genealogy #genealogy

RE: https://en.osm.town/@seav/117372213490233596

Even if you don’t create maps follow along with #30DayMapChallenge for some inspiration and fun! Telling stories with maps. #histodons #mapping @map_enthusiasts @histodons @genealogy #genealogy

0

Centralia, PA: the street grid outlived the town

preview

Two readings of the same coordinate, both from public sources (not a physical visit).

From the street: Centralia, PA looks like a town that was just paused. Asphalt intact. Double-yellow lines. Stop signs on all four corners. Power lines still up. No barricades. If you didn’t know, you’d think everyone was coming back.

From above: the buildings are gone. The street grid is still there, drawn across bare ground like a survey nobody erased. And the stripped ground doesn’t follow the streets. It follows the old coal workings underneath.

The fire started in 1962 in the borough landfill, on an exposed coal seam. It is still burning. The 2000 census counted 16 residents; the 2020 census counted 5. The ZIP code (17927) was revoked in 2002. The state bought and demolished the homes.

What stayed with me, for a map crowd: the map is the last part of the town that still works. The street grid is still a plan for a place that isn’t there anymore.

Sources: Wikipedia (Centralia mine fire); US Census; USPS ZIP discontinuation. Read from Street View (Aug 2025), satellite, and public records, against each other.

Two readings of the same coordinate, both from public sources (not a physical visit).

From the street: Centralia, PA looks like a town that was just paused. Asphalt intact. Double-yellow lines. Stop signs on all four corners. Power lines still up. No barricades. If you didn’t know, you’d think everyone was coming back.

From above: the buildings are gone. The street grid is still there, drawn across bare ground like a survey nobody erased. And the stripped ground doesn’t follow the streets. It follows the old coal workings underneath.

The fire started in 1962 in the borough landfill, on an exposed coal seam. It is still burning. The 2000 census counted 16 residents; the 2020 census counted 5. The ZIP code (17927) was revoked in 2002. The state bought and demolished the homes.

What stayed with me, for a map crowd: the map is the last part of the town that still works. The street grid is still a plan for a place that isn’t there anymore.

Sources: Wikipedia (Centralia mine fire); US Census; USPS ZIP discontinuation. Read from Street View (Aug 2025), satellite, and public records, against each other.

0

StoryMaps

preview

cross-posted from: programming.dev/post/56580364

These articles feel like scrolling through infographics or watching a mini documentary. I really enjoyed “Urban Africa” but there are many others to go through… Which one was your favorite and why? drop a comment :)

cross-posted from: programming.dev/post/56580364

These articles feel like scrolling through infographics or watching a mini documentary. I really enjoyed “Urban Africa” but there are many others to go through… Which one was your favorite and why? drop a comment :)

0

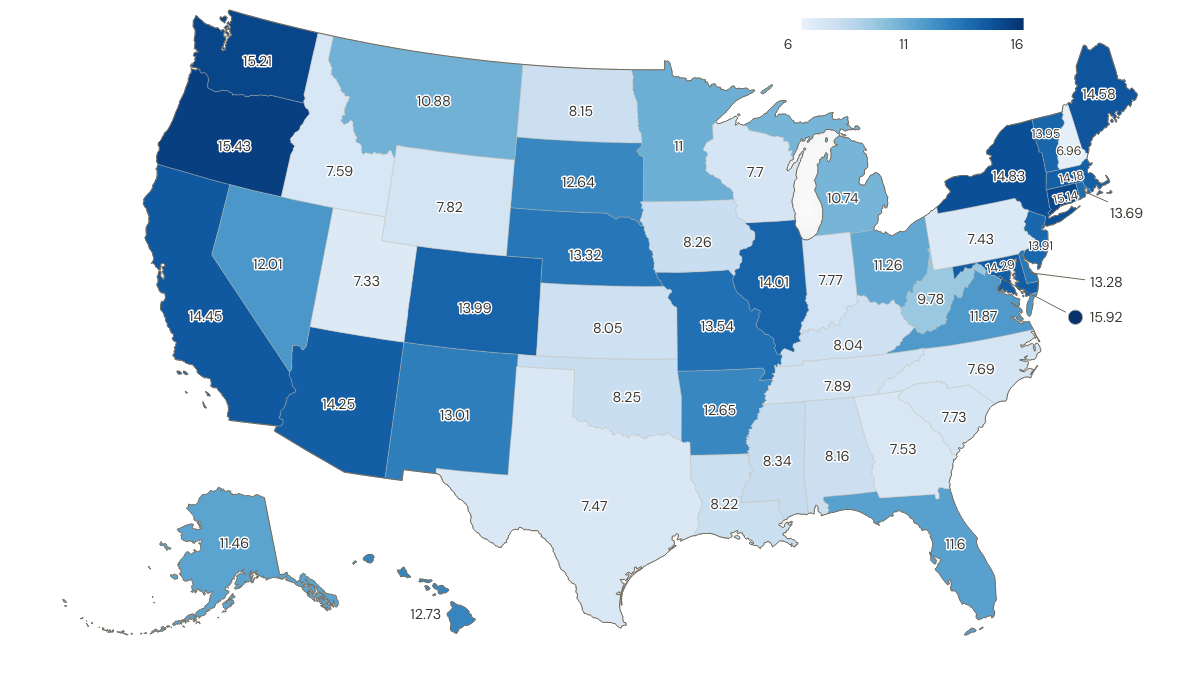
Minimum wage adjusted for regional purchasing power, USA, in 2024, in USD

preview

So it looks like your bang doesn’t go tooo far for your buck even if you live in a LCOL state when you are on minimum wage I guess

Is this useful? What do you think? I honestly don’t know, but seen that I already had the data from this discussion, why not plot it?

I tried to find a map with it, but my searching skills seem to have deteriorated (or search engines aren’t great nowadays)

Data taken from St. Louis Fed’s FRED (Federal Reserve Economic Data) for “Regional Price Parities (RPP): All Items” and “State Minimum Wage Rate”

Latest data available for RPP is 2024, so I used same date for wages. For states with no minimum-wage law or a minimum wage below the federal minimum wage, federal minimum wage was applied like the folks at Economic Policy Institute do

Convertion based on following formula:

real wage = nominal wage * (100 / RPP)

Plotted with ultimaps.com, if anyone has another alternative that shows data + state abbreviation, lmk

What flaws do you see on this map? Where does it fail? I guess metro areas are always complicated and a more granular approach with county data would be more useful, right?

So it looks like your bang doesn’t go tooo far for your buck even if you live in a LCOL state when you are on minimum wage I guess

Is this useful? What do you think? I honestly don’t know, but seen that I already had the data from this discussion, why not plot it?

I tried to find a map with it, but my searching skills seem to have deteriorated (or search engines aren’t great nowadays)

Data taken from St. Louis Fed’s FRED (Federal Reserve Economic Data) for “Regional Price Parities (RPP): All Items” and “State Minimum Wage Rate”

Latest data available for RPP is 2024, so I used same date for wages. For states with no minimum-wage law or a minimum wage below the federal minimum wage, federal minimum wage was applied like the folks at Economic Policy Institute do

Convertion based on following formula:

real wage = nominal wage * (100 / RPP)

Plotted with ultimaps.com, if anyone has another alternative that shows data + state abbreviation, lmk

What flaws do you see on this map? Where does it fail? I guess metro areas are always complicated and a more granular approach with county data would be more useful, right?

0

The world's filming locations: 14,611 places where films and TV were actually shot

A dark world map with every recorded film and television filming location drawn as a coloured dot, dense across North America and Europe, thinning across Africa and central Asia.
preview

Every dot is a place where a film or a series was really shot, taken from the filming location statements on Wikidata and from the filming sections of Wikipedia articles. 14,611 locations from 9,201 films and series, across 156 countries.

It is not complete and it is not meant to look complete. It holds what Wikidata and Wikipedia actually record, so India has 406 locations against an industry that makes more films than Hollywood, and about half the dots resolve to a town rather than to the exact spot.

I hope to add more points and items on the map. Free, no ads, no signup: thefilmmap.com

Every dot is a place where a film or a series was really shot, taken from the filming location statements on Wikidata and from the filming sections of Wikipedia articles. 14,611 locations from 9,201 films and series, across 156 countries.

It is not complete and it is not meant to look complete. It holds what Wikidata and Wikipedia actually record, so India has 406 locations against an industry that makes more films than Hollywood, and about half the dots resolve to a town rather than to the exact spot.

I hope to add more points and items on the map. Free, no ads, no signup: thefilmmap.com

0

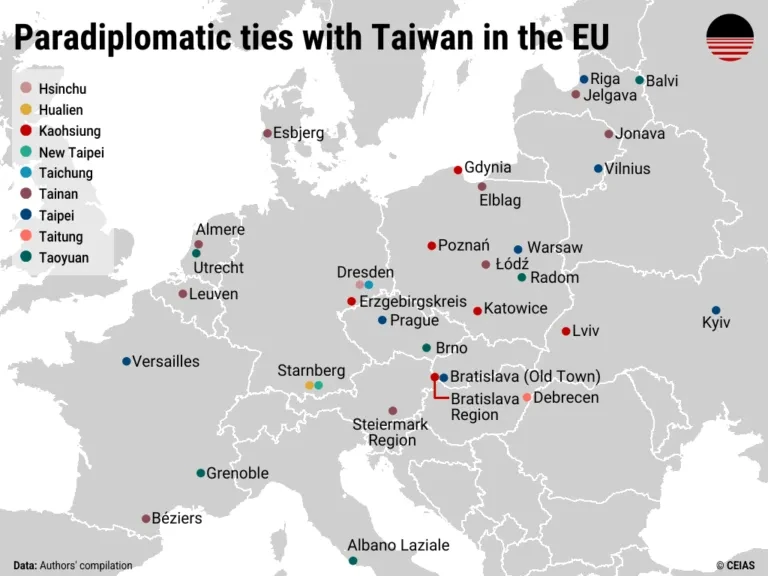
Paradiplomatic ties with Taiwan in the EU

A map of Europe highlighting cities in paradiplomatic relationship with their Taiwanese counterparts. The highest concentration is in Poland.
preview

Source: Jun 2026 report from CEIAS (Central European Institute of Asian Studies): Sister cities, strategic gaps: Taiwan’s uneven paradiplomacy in Europe.

Via this post.

A few interesting tidbits from the report:

On the Taiwanese side, the most active cities are Tainan (nine European partners), Kaohsiung (7), Taoyuan (6), and Taipei (6). Hsinchu, Hualien, New Taipei, Taichung, and Taitung also maintain singular ties with local or regional governments in Europe. On the European side, Poland is the most active, with seven cities (Elblag, Gdynia, Katowice, Łódz, Poznań, Radom, and Warsaw) having partnerships with Taiwanese counterparts. This is followed by Germany, where three municipalities (Dresden, Erzgebirgskreis, and Starnberg) have as many as five ties to Taiwan. Paradiplomatic relations are also found in France (3), Latvia (3), Czechia (2), Lithuania (2), the Netherlands (2), Slovakia (2), Ukraine (2), Belgium (1), Denmark (1), Hungary (1), and Italy (1). The Nordic countries and Southern Europe remain notable gaps in Taiwan’s current paradiplomatic outreach.

For Taiwan, these paradiplomatic ties complement broader outreach efforts by creating an additional channel for international engagement amid constraints in the formal diplomatic system. They can create additional opportunities for engagement with European actors. Sister-city partnerships can facilitate cooperation with European local economies and governance networks through cooperation in areas such as innovation, the green transition, urban planning, or public health. Repeated exchanges and joint initiatives may also help normalize Taiwan’s presence as a capable partner, even if such cooperation remains politically sensitive in certain contexts.

(…) officials in many European cities operate under the impression that pursuing cooperation with Taiwanese partners may lead to boycotts by Chinese tourists and other forms of Chinese retaliation, which is one reason Edinburgh pre-emptively shelved a friendship agreement with Kaohsiung in 2024.

By contrast, other European cities, including Prague, have been more willing to absorb or dismiss such risks. In 2019, the city moved to terminate its sister-city agreement with Beijing over a dispute concerning the “One-China” clause and, in 2020, signed a new partnership with Taipei. The move triggered a series of retaliatory measures from China: Shanghai canceled its agreement with Prague, Chinese authorities blocked or discouraged Czech cultural performances and tours in China, and Chinese officials issued repeated diplomatic warnings to Czech counterparts. Despite these actions, Prague not only maintained but further deepened its engagement with Taiwan, suggesting a willingness to absorb reputational and diplomatic costs in pursuit of a values- and interest-driven partnership.

The Pact was established in 2019 by four Central European capitals—Bratislava, Budapest, Prague, and Warsaw—to share best practices in urban development and municipal governance, as well as to resist illiberal and populist practices of their respective central governments. Since then, the regional platform has expanded to cover municipalities across Europe, such as Berlin, Paris, Riga, and Vienna, and across North America, including Los Angeles, Boston, Seattle, and Chicago. It currently boasts 45 members. In 2021, the Taiwanese cities of Taipei and Taoyuan became the Pact’s first, and so far only, members from East Asia.

Solidarity with Ukraine, and parallels between Russian aggression of the country with potential future invasion of Taiwan by China, has also sped up engagements between Taiwan and Ukraine. Even if Ukraine’s central government remains wary of official contacts so as not to spur even more Chinese support for Russia, on the subnational level relations are taking off. Taipei and Kyiv signed a cooperation memorandum in 2023, while Lviv and Kaohsiung established ties in 2025.

Source: Jun 2026 report from CEIAS (Central European Institute of Asian Studies): Sister cities, strategic gaps: Taiwan’s uneven paradiplomacy in Europe.

Via this post.

A few interesting tidbits from the report:

On the Taiwanese side, the most active cities are Tainan (nine European partners), Kaohsiung (7), Taoyuan (6), and Taipei (6). Hsinchu, Hualien, New Taipei, Taichung, and Taitung also maintain singular ties with local or regional governments in Europe. On the European side, Poland is the most active, with seven cities (Elblag, Gdynia, Katowice, Łódz, Poznań, Radom, and Warsaw) having partnerships with Taiwanese counterparts. This is followed by Germany, where three municipalities (Dresden, Erzgebirgskreis, and Starnberg) have as many as five ties to Taiwan. Paradiplomatic relations are also found in France (3), Latvia (3), Czechia (2), Lithuania (2), the Netherlands (2), Slovakia (2), Ukraine (2), Belgium (1), Denmark (1), Hungary (1), and Italy (1). The Nordic countries and Southern Europe remain notable gaps in Taiwan’s current paradiplomatic outreach.

For Taiwan, these paradiplomatic ties complement broader outreach efforts by creating an additional channel for international engagement amid constraints in the formal diplomatic system. They can create additional opportunities for engagement with European actors. Sister-city partnerships can facilitate cooperation with European local economies and governance networks through cooperation in areas such as innovation, the green transition, urban planning, or public health. Repeated exchanges and joint initiatives may also help normalize Taiwan’s presence as a capable partner, even if such cooperation remains politically sensitive in certain contexts.

(…) officials in many European cities operate under the impression that pursuing cooperation with Taiwanese partners may lead to boycotts by Chinese tourists and other forms of Chinese retaliation, which is one reason Edinburgh pre-emptively shelved a friendship agreement with Kaohsiung in 2024.

By contrast, other European cities, including Prague, have been more willing to absorb or dismiss such risks. In 2019, the city moved to terminate its sister-city agreement with Beijing over a dispute concerning the “One-China” clause and, in 2020, signed a new partnership with Taipei. The move triggered a series of retaliatory measures from China: Shanghai canceled its agreement with Prague, Chinese authorities blocked or discouraged Czech cultural performances and tours in China, and Chinese officials issued repeated diplomatic warnings to Czech counterparts. Despite these actions, Prague not only maintained but further deepened its engagement with Taiwan, suggesting a willingness to absorb reputational and diplomatic costs in pursuit of a values- and interest-driven partnership.

The Pact was established in 2019 by four Central European capitals—Bratislava, Budapest, Prague, and Warsaw—to share best practices in urban development and municipal governance, as well as to resist illiberal and populist practices of their respective central governments. Since then, the regional platform has expanded to cover municipalities across Europe, such as Berlin, Paris, Riga, and Vienna, and across North America, including Los Angeles, Boston, Seattle, and Chicago. It currently boasts 45 members. In 2021, the Taiwanese cities of Taipei and Taoyuan became the Pact’s first, and so far only, members from East Asia.

Solidarity with Ukraine, and parallels between Russian aggression of the country with potential future invasion of Taiwan by China, has also sped up engagements between Taiwan and Ukraine. Even if Ukraine’s central government remains wary of official contacts so as not to spur even more Chinese support for Russia, on the subnational level relations are taking off. Taipei and Kyiv signed a cooperation memorandum in 2023, while Lviv and Kaohsiung established ties in 2025.

0

Australia’s Indigenous Protected Area

preview

Source from 14 May 2026. I haven’t checked if any new IPAs or Key Biodiversity Areas have been established after this date

Proponents of Indigenous Protected Area (IPA) say they can empower Indigenous Australians as decision-makers in land management, combining traditional ecological knowledge with conservation goals.

IPAs now account for 54% of Australia’s progress toward protecting 30% of its territory by 2030

While research shows every $1 invested in IPAs yields up to $3.40 in social, economic and environmental returns, advocates stress that Indigenous communities still need meaningful, sustained support.

[…]

O’Leary of Country Needs People acknowledges the system isn’t perfect, and says successful IPAs rely on careful planning, support and engagement. But, he says, they represent a critical tool that’s being used right now.

“Yes, there are a lot of things to be improved,” he adds. “But this is happening on the ground now in real time. It’s not being theorized in academic papers or in international forums alone. It’s actually happening on the ground for people, and that is where the rubber hits the road.”

Source from 14 May 2026. I haven’t checked if any new IPAs or Key Biodiversity Areas have been established after this date

Proponents of Indigenous Protected Area (IPA) say they can empower Indigenous Australians as decision-makers in land management, combining traditional ecological knowledge with conservation goals.

IPAs now account for 54% of Australia’s progress toward protecting 30% of its territory by 2030

While research shows every $1 invested in IPAs yields up to $3.40 in social, economic and environmental returns, advocates stress that Indigenous communities still need meaningful, sustained support.

[…]

O’Leary of Country Needs People acknowledges the system isn’t perfect, and says successful IPAs rely on careful planning, support and engagement. But, he says, they represent a critical tool that’s being used right now.

“Yes, there are a lot of things to be improved,” he adds. “But this is happening on the ground now in real time. It’s not being theorized in academic papers or in international forums alone. It’s actually happening on the ground for people, and that is where the rubber hits the road.”

0

Countries that have banned paraquat, a highly toxic herbicide virtually proven to cause Parkinson’s disease

preview

Nations that have banned paraquat in white

Source from Feb, 2026 by EWG (Environmental Working Group). If anyone has a more updated version, feel free to share it

Notes:
Myanmar:

From 1 April [2026] onwards, paraquat will no longer be permitted to be registered, imported, sold, formulated or repackaged in Myanmar

Canada:

In Canada, Syngenta was the only paraquat manufacturer with a registered product. Syngenta discontinued registering its product in Canada in 2023 following updated risk-mitigation efforts. Although there is not an outright ban, no paraquat products are sold in Canada.

India:

The draft ‘Banning of Paraquat Dichloride Order, 2026’, issued by the Ministry of Agriculture and Farmers Welfare, was published in the Gazette of India on July 13 and will remain open for public comments for 30 days before a final decision is taken. Did it pass? I cant find much on it

In the USA before California’s ban a couple of days ago:

Nations that have banned paraquat in white

Source from Feb, 2026 by EWG (Environmental Working Group). If anyone has a more updated version, feel free to share it

Notes:
Myanmar:

From 1 April [2026] onwards, paraquat will no longer be permitted to be registered, imported, sold, formulated or repackaged in Myanmar

Canada:

In Canada, Syngenta was the only paraquat manufacturer with a registered product. Syngenta discontinued registering its product in Canada in 2023 following updated risk-mitigation efforts. Although there is not an outright ban, no paraquat products are sold in Canada.

India:

The draft ‘Banning of Paraquat Dichloride Order, 2026’, issued by the Ministry of Agriculture and Farmers Welfare, was published in the Gazette of India on July 13 and will remain open for public comments for 30 days before a final decision is taken. Did it pass? I cant find much on it

In the USA before California’s ban a couple of days ago:

0

The world's castles, fortresses and palaces as points of light: 5,793 landmarks across 138 countries

World map with 5,793 castles, fortresses and palaces drawn as points of light on a dark background. Europe is densely lit, most other regions sparse.
preview

I built this map from open data. Every point is one of 5,793 castles, fortresses, palaces and ruins across 138 countries: 2,591 castles, 1,180 fortresses, 934 palaces and 1,088 ruins. The density is the story. Europe blazes while most of the planet stays dark.

It is a curated atlas, not a complete inventory. Germany alone has an estimated 25,000 castle sites (According to some sources). A landmark makes the map when it has a real photo on Wikimedia Commons, a Wikipedia article and exact coordinates in Wikidata, balanced across countries so the map stays explorable. France leads with 351.

You can explore every one interactively at thecastlemap.com with photos, founding centuries and short stories, plus a daily Guess the Castle game. There are no ads or sign up, everything CC0 and free to download.

I built this map from open data. Every point is one of 5,793 castles, fortresses, palaces and ruins across 138 countries: 2,591 castles, 1,180 fortresses, 934 palaces and 1,088 ruins. The density is the story. Europe blazes while most of the planet stays dark.

It is a curated atlas, not a complete inventory. Germany alone has an estimated 25,000 castle sites (According to some sources). A landmark makes the map when it has a real photo on Wikimedia Commons, a Wikipedia article and exact coordinates in Wikidata, balanced across countries so the map stays explorable. France leads with 351.

You can explore every one interactively at thecastlemap.com with photos, founding centuries and short stories, plus a daily Guess the Castle game. There are no ads or sign up, everything CC0 and free to download.

0

The world's passenger railways: 1,166 notable train routes on one map

preview

Every notable passenger train route I could verify, drawn on one map with no basemap under it, so the rail lines themselves trace the coastlines. 1,166 routes across 119 countries, about 309,000 km of line once shared corridors are counted once.

Coloured by what kind of journey it is: 459 classic intercity, 246 scenic, 138 heritage, 135 high-speed, 108 night trains, 48 funiculars, 32 luxury cruise trains.

The geometry is the part I have spent the most time on. Route shapes are traced from OpenStreetMap railway relations and ways rather than drawn by hand, so the lines sit on real track. This week I finished a pass that put the last stragglers on their actual alignment, including a Saudi line that turned out to be running 200 km up a branch and back down again.

It is a free hobby project, no ads and no signup, and the route data is open. Corrections are genuinely welcome and get credited; forum readers have already fixed a number of errors in it.

Caveat worth stating plainly: it is a curated atlas of notable routes, not a complete inventory of the world’s railways. Somewhere like China or Germany has far more track than the routes shown here.

trainrouter.com

Every notable passenger train route I could verify, drawn on one map with no basemap under it, so the rail lines themselves trace the coastlines. 1,166 routes across 119 countries, about 309,000 km of line once shared corridors are counted once.

Coloured by what kind of journey it is: 459 classic intercity, 246 scenic, 138 heritage, 135 high-speed, 108 night trains, 48 funiculars, 32 luxury cruise trains.

The geometry is the part I have spent the most time on. Route shapes are traced from OpenStreetMap railway relations and ways rather than drawn by hand, so the lines sit on real track. This week I finished a pass that put the last stragglers on their actual alignment, including a Saudi line that turned out to be running 200 km up a branch and back down again.

It is a free hobby project, no ads and no signup, and the route data is open. Corrections are genuinely welcome and get credited; forum readers have already fixed a number of errors in it.

Caveat worth stating plainly: it is a curated atlas of notable routes, not a complete inventory of the world’s railways. Somewhere like China or Germany has far more track than the routes shown here.

trainrouter.com

0

An oblique equirectangular world map showing the longest straight line over land

preview

Inspired by a comment by hupakee@lemmy.world under SurrealPartisan’s recent post in this community

The longest straight line over land is this great circle (see NeatNit’s comment here if the link isn’t working for you, sorry about that). But, of course, most great circles don’t look very straight on most maps. To correct for this, I (very roughly) got the northernmost point of the great circle and put that value into G.Projector to get an oblique equirectangular projection that treats the great circle as if it were the equator on a regular map

The base map is Wikimedia Commons’ equirectangular projection map

Inspired by a comment by hupakee@lemmy.world under SurrealPartisan’s recent post in this community

The longest straight line over land is this great circle (see NeatNit’s comment here if the link isn’t working for you, sorry about that). But, of course, most great circles don’t look very straight on most maps. To correct for this, I (very roughly) got the northernmost point of the great circle and put that value into G.Projector to get an oblique equirectangular projection that treats the great circle as if it were the equator on a regular map

The base map is Wikimedia Commons’ equirectangular projection map

0

Has anyone named this projection yet?

preview

Recently, I finally started a hobby I’ve been thinking about for a long time, i.e., designing my own map projections. This one has such a simple but clever idea that I wouldn’t be surprised to hear it’s an already known one.

Basically, longitude is scaled by the cosine of the corresponding latitude, like in the sinusoidal projection. But then latitude is scaled by its own sine to avoid those sharp poles (and to emphasize the areas near the equator), and a constant to make it a circle.

So, does anyone know a pre-existing name for this? Alternatively, feel free to suggest a new name for it.

Recently, I finally started a hobby I’ve been thinking about for a long time, i.e., designing my own map projections. This one has such a simple but clever idea that I wouldn’t be surprised to hear it’s an already known one.

Basically, longitude is scaled by the cosine of the corresponding latitude, like in the sinusoidal projection. But then latitude is scaled by its own sine to avoid those sharp poles (and to emphasize the areas near the equator), and a constant to make it a circle.

So, does anyone know a pre-existing name for this? Alternatively, feel free to suggest a new name for it.

0

Hindu Kush Himalayan Region

preview

Source: researchgate.net/…/Map-of-the-Hindu-Kush-Himalaya…

Searchable Source: “Natural Resource Governance at Multiple Scales in the Hindu Kush Himalaya” (PDF)

Source: researchgate.net/…/Map-of-the-Hindu-Kush-Himalaya…

Searchable Source: “Natural Resource Governance at Multiple Scales in the Hindu Kush Himalaya” (PDF)

0

Legal status map for plug-in solar in the USA

preview

Source here with detailed information for each state in case you are interested in getting a balcony or window mounted solar system

Plug-in solar lets anyone generate free electricity — no roof, no permit, no contractor. A single panel on your balcony can meaningfully cut your bill, especially as rates keep rising.

Found it in this discussion: !slrpnk.net/post/39512229/22991609

Is it already legal in your country/state?

Source here with detailed information for each state in case you are interested in getting a balcony or window mounted solar system

Plug-in solar lets anyone generate free electricity — no roof, no permit, no contractor. A single panel on your balcony can meaningfully cut your bill, especially as rates keep rising.

Found it in this discussion: !slrpnk.net/post/39512229/22991609

Is it already legal in your country/state?

0

I found a globe!

preview

Hello Map Enthusiasts!

I was looking through old boxes from my childhood and found my grandfather’s old globe. I recall each of us using it to look at different countries and learn where they all are. When I opened up the box now, more than a decade after his passing, I decided I wanted to know more about it.

The label says that it is a Cram Imperial Globe, and I looked up how to date the globe based on which countries are in existence on it. I determined that this globe must have been made between May 1990 and October 1990 because it has a unified Yemen on it, but still has East and West Germany on it.

It’s in pretty decent shape for its age I think. There are spots where I think grandpa had to tape the equator back on it haha

Hello Map Enthusiasts!

I was looking through old boxes from my childhood and found my grandfather’s old globe. I recall each of us using it to look at different countries and learn where they all are. When I opened up the box now, more than a decade after his passing, I decided I wanted to know more about it.

The label says that it is a Cram Imperial Globe, and I looked up how to date the globe based on which countries are in existence on it. I determined that this globe must have been made between May 1990 and October 1990 because it has a unified Yemen on it, but still has East and West Germany on it.

It’s in pretty decent shape for its age I think. There are spots where I think grandpa had to tape the equator back on it haha

0

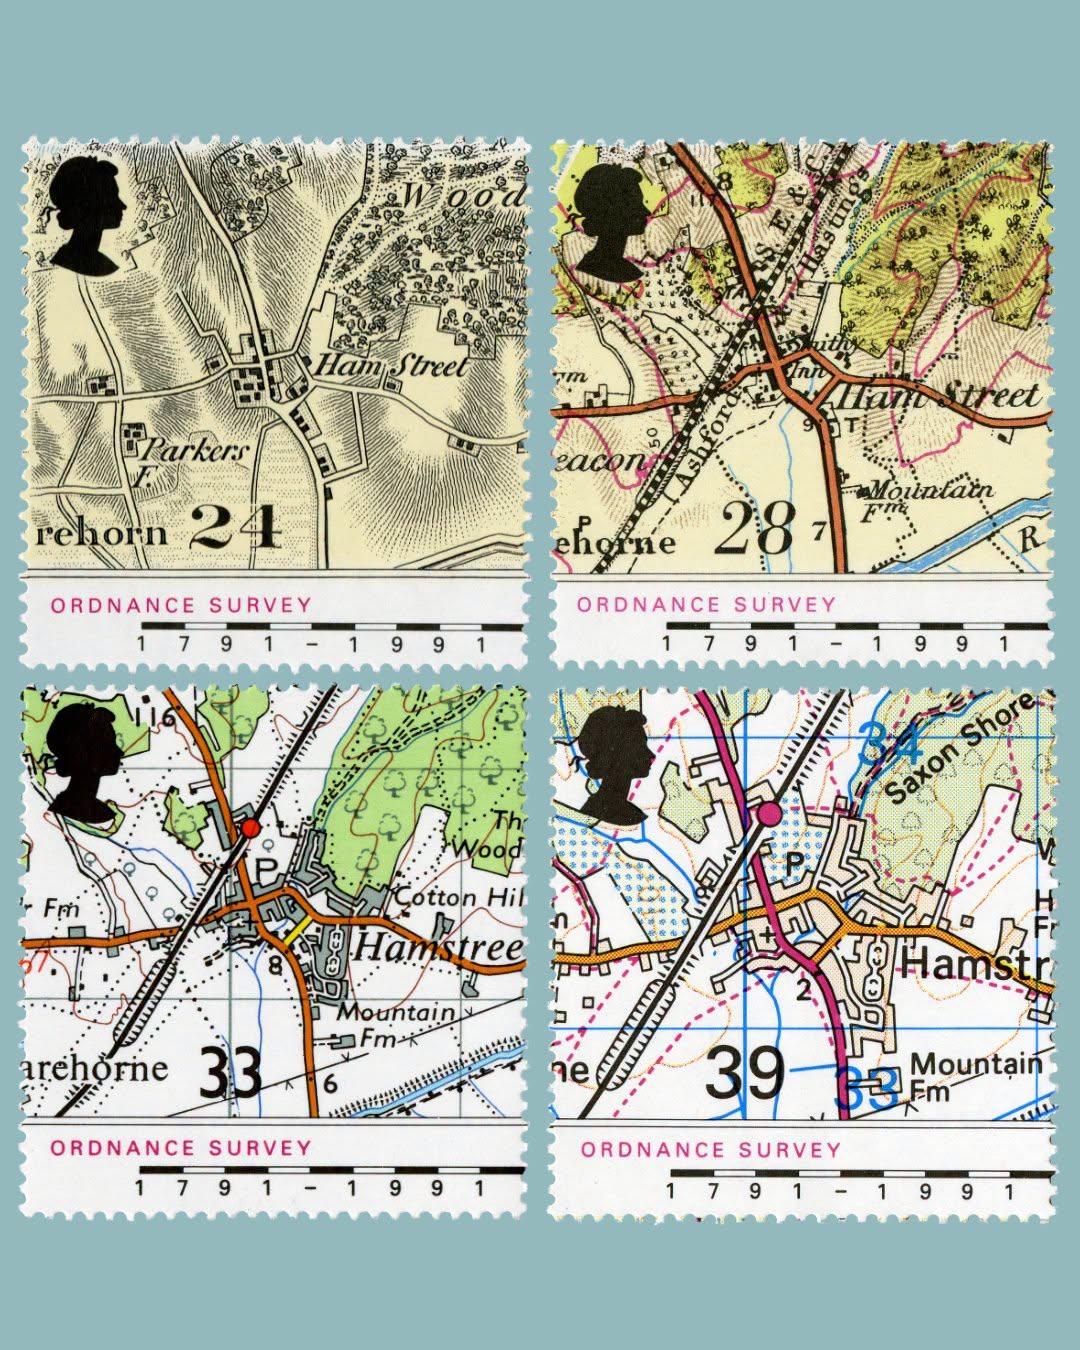
Ordnance Survey is 235 years old today, 21 June.

Four UK postage stamps on a grey background. Each stamp shows a small section of an Ordnance Survey map from four different dates.
preview

Ordnance Survey is 235 years old today, 21 June.
These stamps were produced in 1991 and show snippets of a map of the village of Hamstreet in Kent from 1816, 1906, 1959 and 1991. Chosen because the very first map produced by Ordnance Survey was of the county of Kent. Text and image from https://postalmuseum.org/ @map_enthusiasts #maps #OrdnanceSurvey #Kent #England

Ordnance Survey is 235 years old today, 21 June.
These stamps were produced in 1991 and show snippets of a map of the village of Hamstreet in Kent from 1816, 1906, 1959 and 1991. Chosen because the very first map produced by Ordnance Survey was of the county of Kent. Text and image from https://postalmuseum.org/ @map_enthusiasts #maps #OrdnanceSurvey #Kent #England